Chapter 1
df.head()
df.tail()
df.info()
prints first five entries
prints last five entries
prints the info of all columns
NumPy and pandas working together
import numpy as np

# Create array of DataFrame values: np_vals
np_vals = df.values
Building DataFrames from scratch
list_keys = ['Country', 'Total']
list_values = [['United States', 'Soviet Union', 'United Kingdom'], [1118, 473, 273]]

zipped = list(zip(list_keys , list_values))
print(zipped)
data = dict(zipped)
df = pd.DataFrame(data)
print(df)
[ ( 'Country', [ 'United States', 'Soviet Union', 'United Kingdom' ] ), ( 'Total', [1118, 473, 273] ) ]
|
Country |
Total |
| 0 |
United States |
1118 |
| 1 |
Soviet Union |
473 |
| 2 |
United Kingdom |
273 |
Building DataFrames with broadcasting
state = "PA"
cities=['Manheim','Preston park','Biglerville']

data = {'state':state, 'city':cities}

df = pd.DataFrame(data)
print(df)
|
state |
city |
| 0 |
PA |
Manheim |
| 1 |
PA |
Preston park |
| 2 |
PA |
Biglerville |
Importing & exporting data
Reading a flat file
df1 = pd.read_csv(data_file)
print(df1)
|
Year |
Total Population |
| 0 |
1960 |
3.034971e+09 |
| 1 |
1970 |
3.684823e+09 |
| 2 |
1980 |
4.436590e+09 |
| 3 |
1990 |
5.282716e+09 |
| 4 |
2000 |
6.115974e+09 |
| 5 |
2010 |
6.924283e+09 |
new_labels = ['year', 'population']

df2 = pd.read_csv(data_file, header=0, names=new_labels)
print(df2)
|
year |
population |
| 0 |
1960 |
3.034971e+09 |
| 1 |
1970 |
3.684823e+09 |
| 2 |
1980 |
4.436590e+09 |
| 3 |
1990 |
5.282716e+09 |
| 4 |
2000 |
6.115974e+09 |
| 5 |
2010 |
6.924283e+09 |
Delimiters, headers, and extensions
df1 = pd.read_csv(file_messy)
print(df1.head())

df2 = pd.read_csv(file_messy, delimiter=' ', header=3, comment='#')
print(df2.head())

df2.to_csv(file_clean, index=False)
df2.to_excel('file_clean.xlsx', index=False)
The following stock data was collect on 2016-AUG-25 from an unknown source
These kind of comments are not very useful are they?
Probably should just throw this line away too but not the next since those are column labels
name Jan Feb Mar Apr May Jun Jul Aug SepOct No...NaN
# So that line you just read has all the column...NaN
IBM 156.08 160.01 159.81 165.22 172.25 167.15 1...NaN
|
name |
Jan |
Feb |
... |
Nov |
Dec |
| 0 |
IBM |
156.08 |
160.01 |
... |
137.21 |
137.96 |
| 1 |
MSFT |
45.51 |
43.08 |
... |
53.88 |
55.40 |
| 2 |
GOOGLE |
512.42 |
537.99 |
... |
735.39 |
755.35 |
| 3 |
APPLE |
110.64 |
125.43 |
... |
118.16 |
111.73 |
|
|
|
|
|
|
|
| [4 rows x 13 columns] |
|
|
|
|
|
|
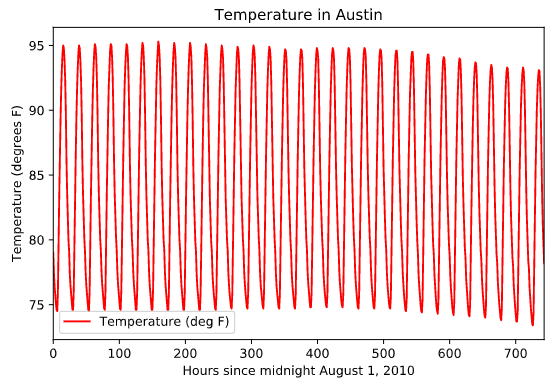
Plotting series using pandas
df.plot(color='red')

plt.title('Temperature in Austin')
plt.xlabel('Hours since midnight August 1, 2010')
plt.ylabel('Temperature (degrees F)')

print(df.head(3))
plt.show()
|
Temperature (deg F) |
| 0 |
79.0 |
| 1 |
77.4 |
| 2 |
76.4 |
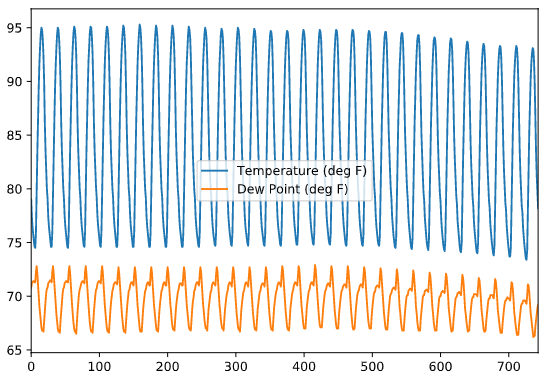
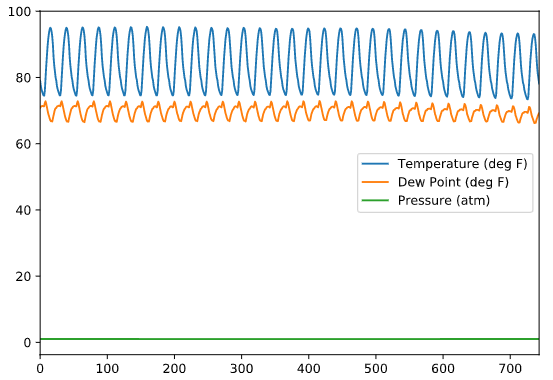
Plotting DataFrames
print(df.head())
|
Temperature (deg F) |
Dew Point (deg F) |
Pressure (atm) |
| 0 |
79.0 |
70.8 |
1.0 |
| 1 |
77.4 |
71.2 |
1.0 |
| 2 |
76.4 |
71.3 |
1.0 |
| 3 |
75.7 |
71.4 |
1.0 |
| 4 |
75.1 |
71.4 |
1.0 |
df.plot()
plt.show()
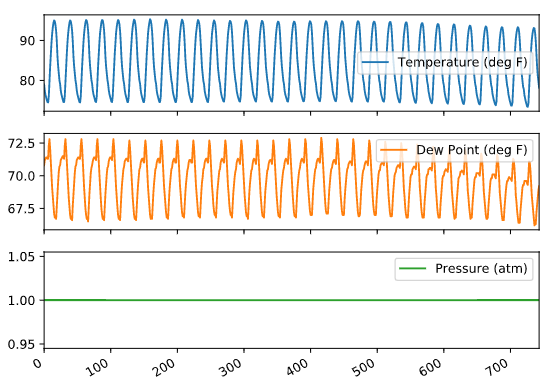
df.plot(subplots=True)
plt.show()
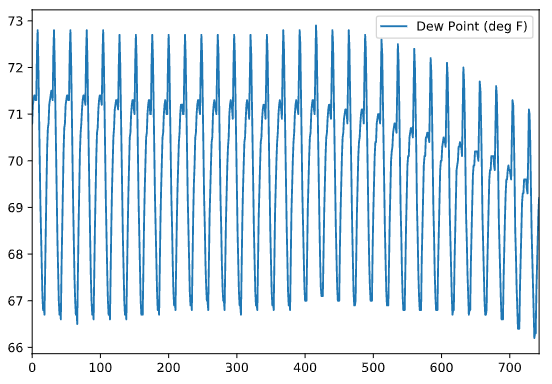
column_list1 = ['Dew Point (deg F)']
df[column_list1].plot()
plt.show()
column_list2 = ['Temperature (deg F)','Dew Point (deg F)']
df[column_list2].plot()
plt.show()